Six months of AI training listings: what grew, and what pay did
From May 14 to November 11, 2026, we compared saved listings from the same five consistently observed sources about every two weeks. Active listing families rose about 15%, with a peak in mid-September. Engineering, generalist and doctor categories grew most among the named role groups, while translation families fell. These are listings, including potential talent pools, rather than confirmed current vacancies. Listed pay for credential and language roles stayed broadly steady.
SignalGigs may earn a referral commission when you apply through links on this site.
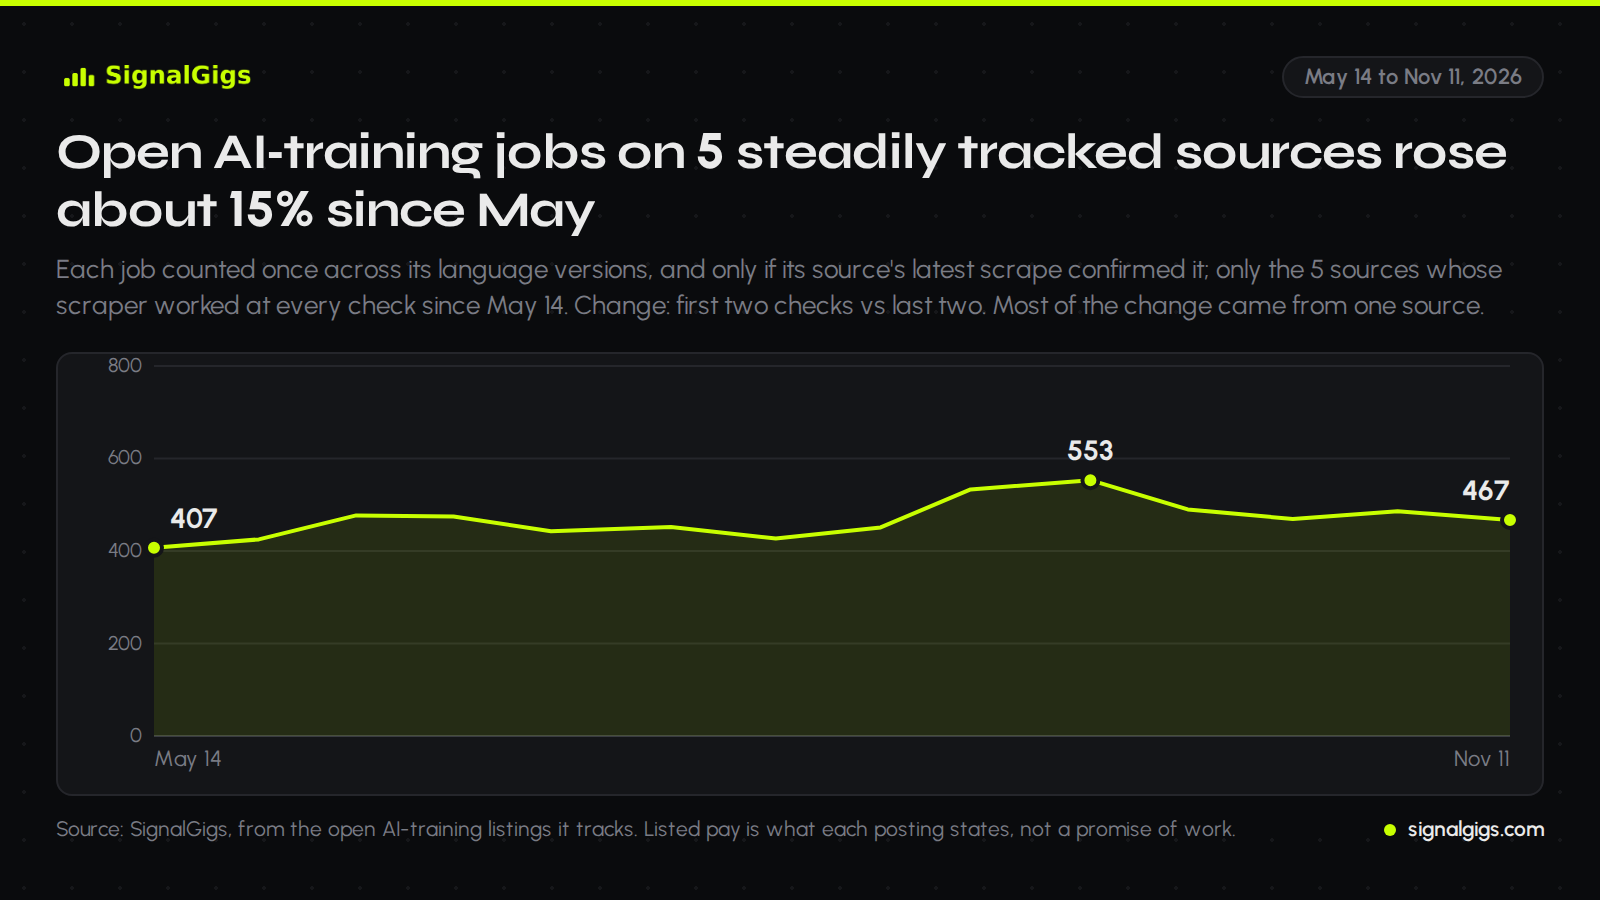
Active listing families rose about 15%, then eased from a September peak
On the five consistently observed sources, 407 AI training listing families were active in the May 14 snapshot and 467 on November 11. Comparing the first two checks with the last two also shows a rise of about 15%. The count peaked at 553 on September 16 and has eased since. One large source added more families than the whole net rise; three of the other four ended with fewer.
We count a role family once even when it is posted in many languages or cities: a role family posted in 30 languages is one family here, not 30. That matters. Counting raw postings, translation work looked like it grew, from about 129 postings to 156, but the number of distinct translation families fell from about 74 to 60. The growth came from new families posted in many languages: most of November's translation postings belong to families that were not active in May, while many older single-language families stopped appearing.
Show the numbers
| Check | Open jobs | Open postings |
|---|---|---|
| May 14 | 407 | 852 |
| May 28 | 425 | 869 |
| Jun 10 | 477 | 960 |
| Jun 23 | 475 | 961 |
| Jul 6 | 443 | 888 |
| Jul 22 | 452 | 1015 |
| Aug 5 | 427 | 983 |
| Aug 19 | 451 | 1043 |
| Aug 31 | 533 | 1107 |
| Sep 16 | 553 | 1104 |
| Sep 29 | 490 | 980 |
| Oct 13 | 469 | 931 |
| Oct 27 | 486 | 978 |
| Nov 11 | 467 | 904 |
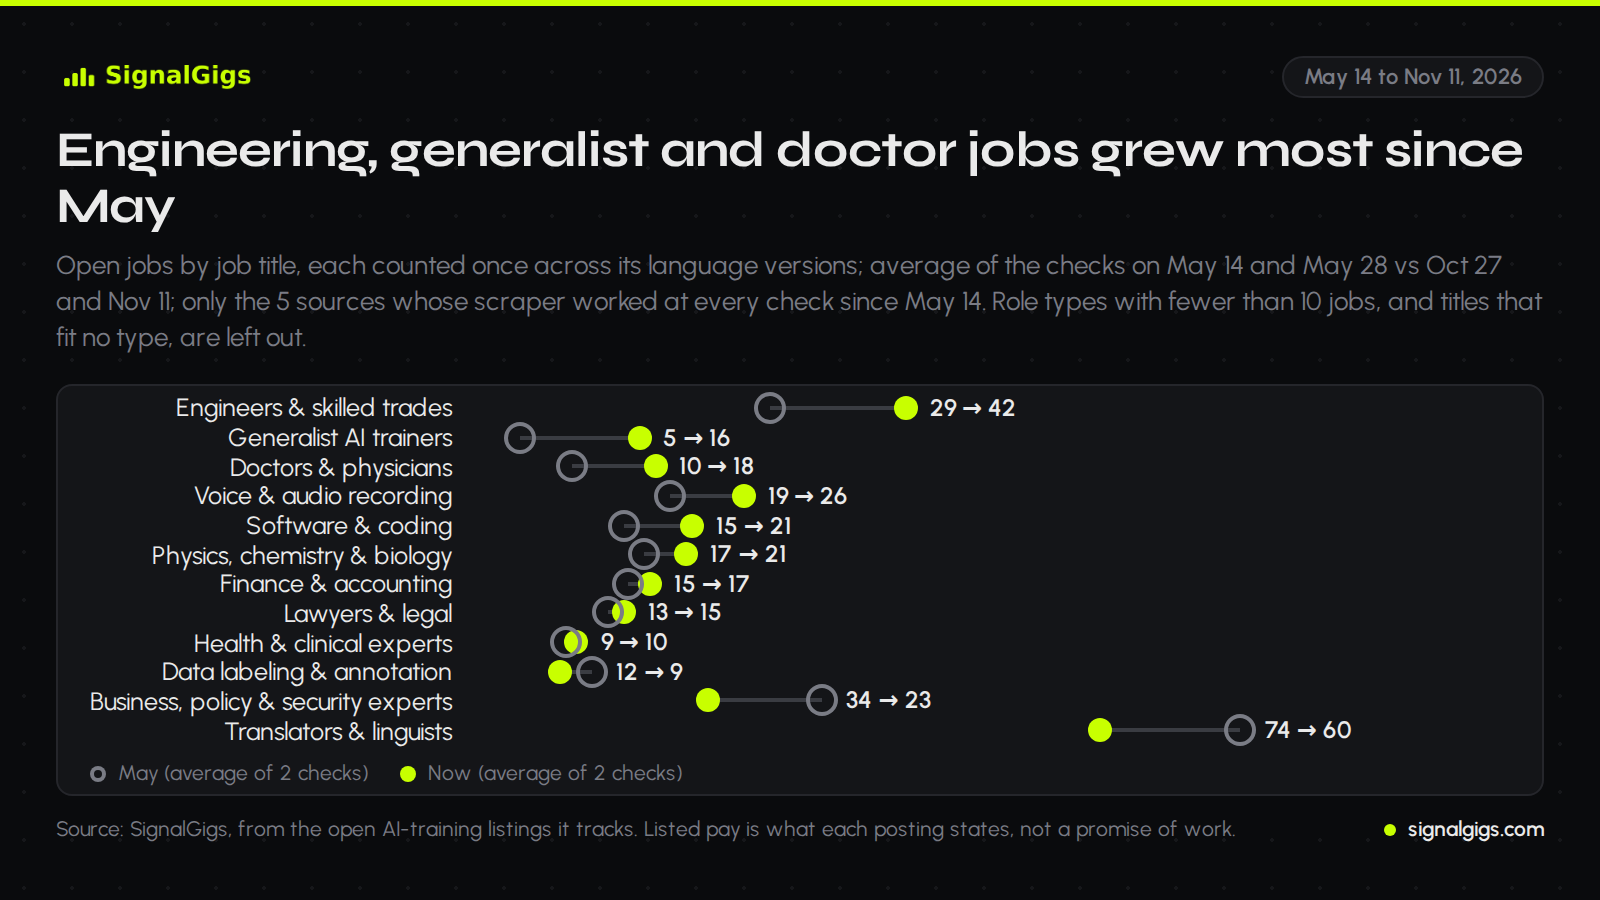
Engineering, generalist and doctor categories led the named groups
Engineering and skilled-trade jobs grew the most among named, title-classified categories, from about 29 to 42 active per snapshot. Generalist AI-trainer jobs went from about 5 to 16, doctor jobs from about 10 to 18, voice and audio recording jobs from 19 to 26, and software jobs from about 15 to 21.
Translation and linguistics jobs fell from about 74 to 60, and so did business, policy and security expert jobs (about 34 to 23) and data-labeling jobs (about 12 to 9). Translation still has more open jobs than any other named role type on these sources.
Show the numbers
| Role type | May | Now |
|---|---|---|
| Engineers & skilled trades | 28.5 | 41.5 |
| Generalist AI trainers | 4.5 | 16 |
| Doctors & physicians | 9.5 | 17.5 |
| Voice & audio recording | 19 | 26 |
| Software & coding | 14.5 | 21 |
| Physics, chemistry & biology | 16.5 | 20.5 |
| Finance & accounting | 15 | 17 |
| Lawyers & legal | 13 | 14.5 |
| Health & clinical experts | 9 | 10 |
| Data labeling & annotation | 11.5 | 8.5 |
| Business, policy & security experts | 33.5 | 22.5 |
| Translators & linguists | 73.5 | 60 |
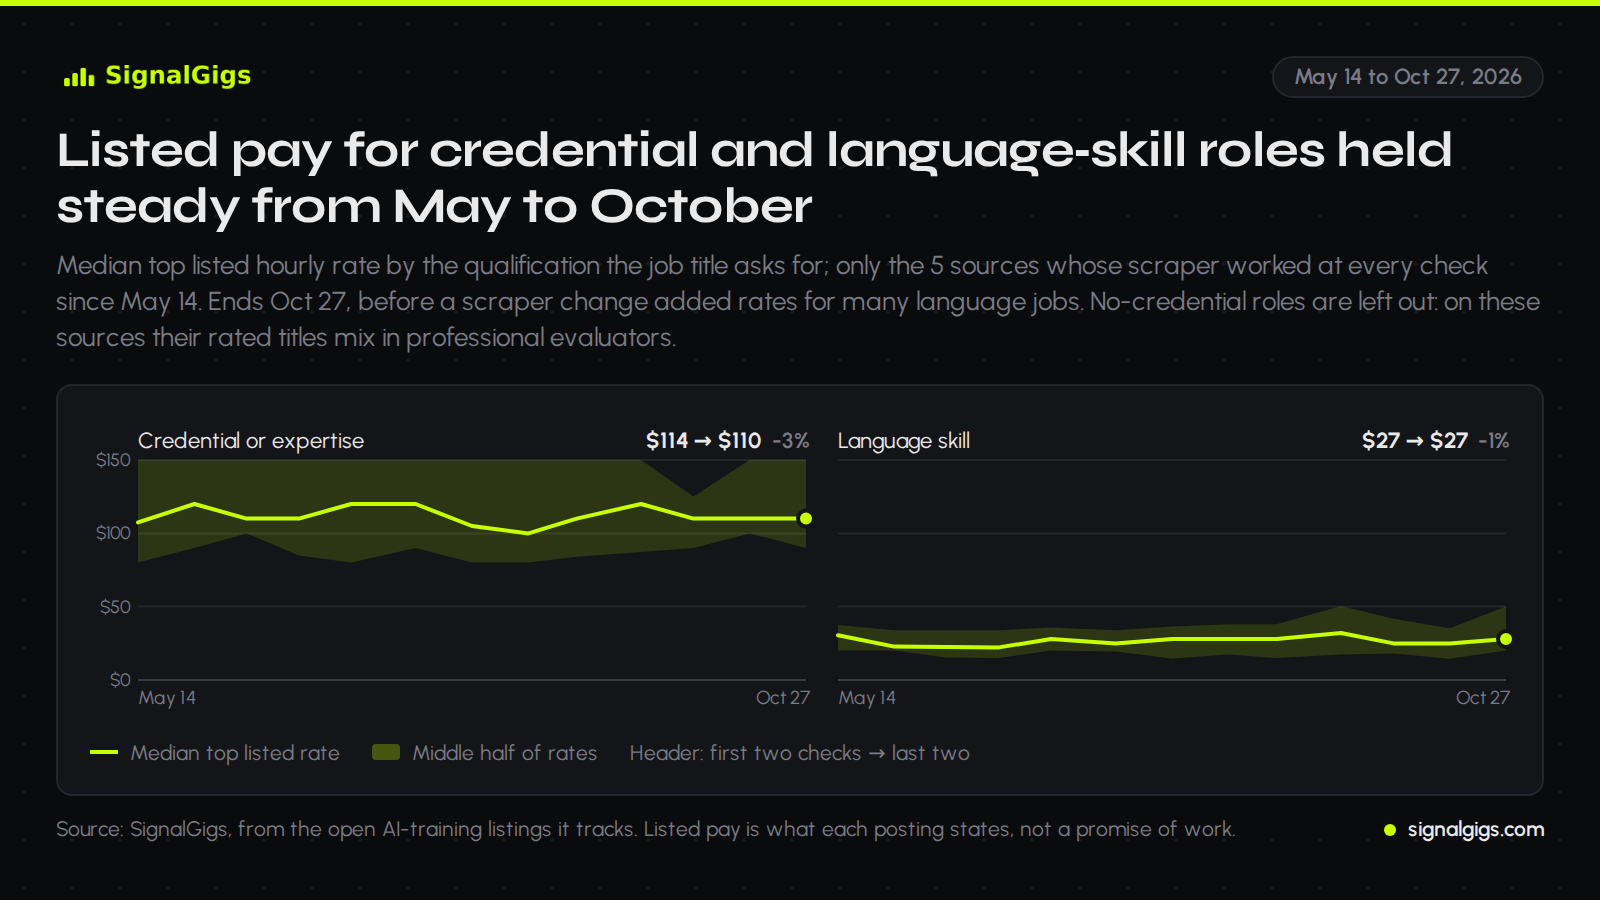
Pay held steady for credential and language roles
We grouped jobs by what the title asks for: a credential or professional expertise (doctors, lawyers, engineers, finance, software, science) or a language skill. From May to October, the median top listed rate for credential roles stayed between $100 and $120 an hour, and for language-skill roles between $22.25 and $32.
Roles that ask for no specific credential are left out of this chart. On these sources, the rated titles in that group include professional evaluator roles and voice actors, so its median jumped as those batches opened and closed. The chart stops on October 27: on November 11 our scraper started reading rates written into the posting text, which added rates for many language jobs at once.
Show the numbers
| Qualification | May | October | Range |
|---|---|---|---|
| Credential or professional expertise | $113.75 | $110 | $100 to $120 |
| Language skill | $26.65 | $26.50 | $22.25 to $32 |
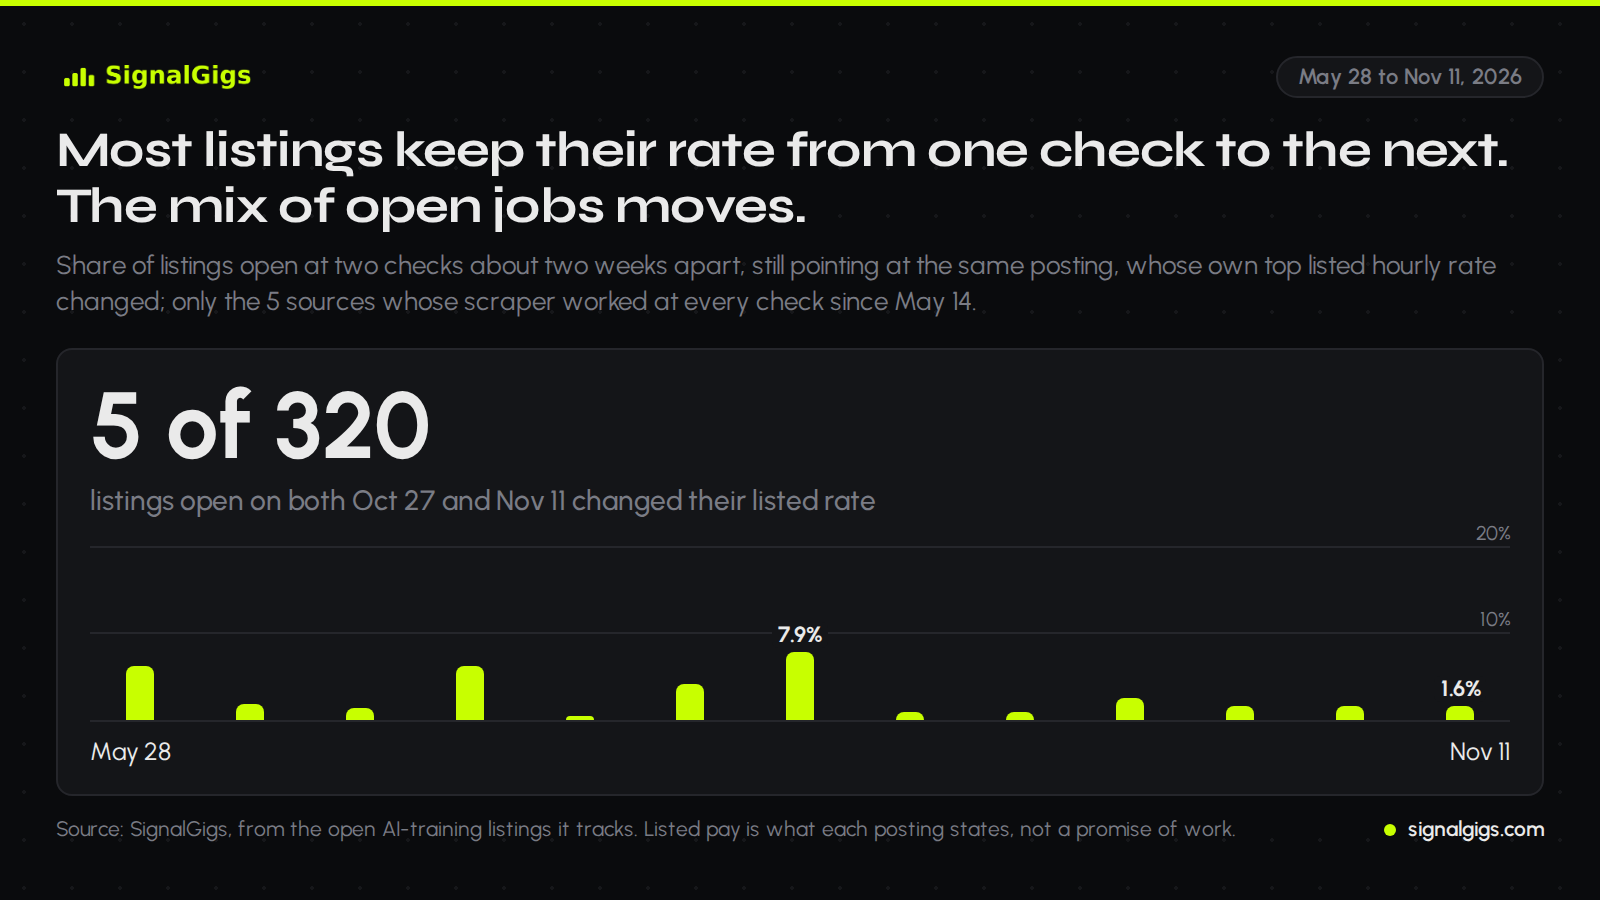
Most listings keep their rate
To see whether pay itself moves, we followed the same listings from one check to the next. At each check, between 0.4% and 7.9% of the listings open at both checks changed their listed rate. Between October 27 and November 11 it was 5 of 320, all of them increases. Changing job mix can move the median even when most continuing listings keep their rate; this comparison does not decompose the causes of median changes.
If you are looking for work, check the current source’s rate, availability and eligibility. Most continuing listings in this historical sample kept their rate; that is not a prediction for an individual posting.
Show the numbers
| Check | Open at both | Changed | Up | Down |
|---|---|---|---|---|
| May 28 | 193 | 12 | 6 | 6 |
| Jun 10 | 172 | 3 | 0 | 3 |
| Jun 23 | 275 | 4 | 3 | 1 |
| Jul 6 | 223 | 14 | 5 | 9 |
| Jul 22 | 241 | 1 | 0 | 1 |
| Aug 5 | 245 | 10 | 10 | 0 |
| Aug 19 | 317 | 25 | 9 | 16 |
| Aug 31 | 425 | 4 | 3 | 1 |
| Sep 16 | 352 | 3 | 0 | 3 |
| Sep 29 | 386 | 10 | 1 | 9 |
| Oct 13 | 360 | 6 | 2 | 4 |
| Oct 27 | 300 | 5 | 1 | 4 |
| Nov 11 | 320 | 5 | 5 | 0 |
Frequently asked questions
Did the number of AI training jobs grow in 2026?
On the five sources we tracked at every check, active listing families rose about 15% from May to November 2026: 407 on May 14 and 467 on November 11, with a peak of 553 on September 16. One large source accounted for most of the rise. Counts can include talent communities rather than active openings. Sources added during the period, or whose scraper broke at any point, are left out, because they would distort the trend.
Did AI training pay go up?
Rates for credential and language roles stayed broadly steady in this sample. From May to October, the median top listed rate for credential roles stayed between $100 and $120 an hour, and for language-skill roles between $22.25 and $32. Most listings kept the same rate from one check to the next: 5 of 320 changed between October 27 and November 11.
Which AI training jobs grew the most?
Engineering and skilled-trade jobs, generalist AI-trainer jobs and doctor jobs grew the most among named, title-classified role groups between May and November 2026. Translation, business-expert and data-labeling jobs fell.
How we measured this
Sources: the five job sources whose scrapers worked at every check from May 14 to November 11, 2026. Sources we added later, or whose scraper broke at any point, are left out, so a scraper problem can't look like a trend.
Active listing families: a family counts at a check when the latest successful saved source run observed at least one of its listings. This is historical saved-record evidence, not a fresh vacancy check; talent communities may be included.
Families and postings: a posting is one listing text. A family groups one source’s core title after language, place and project names are removed. This deduplicates title variants, but does not establish that they describe identical work or contracts.
Pay: the top of each posting's listed hourly range in US dollars. Qualification comes from the job title. Pay is what each posting states; it is not a promise of work or income.
The named-category growth ranking excludes unclassified “other” families, which rose from an average 122.5 to 153.5 between the first and last two checks. Qualification and role groups are inferred from titles, not independently confirmed.